The Drift Channel, 10/09/08
This is a plot of the S&P cash from 1982-10/9/2008.
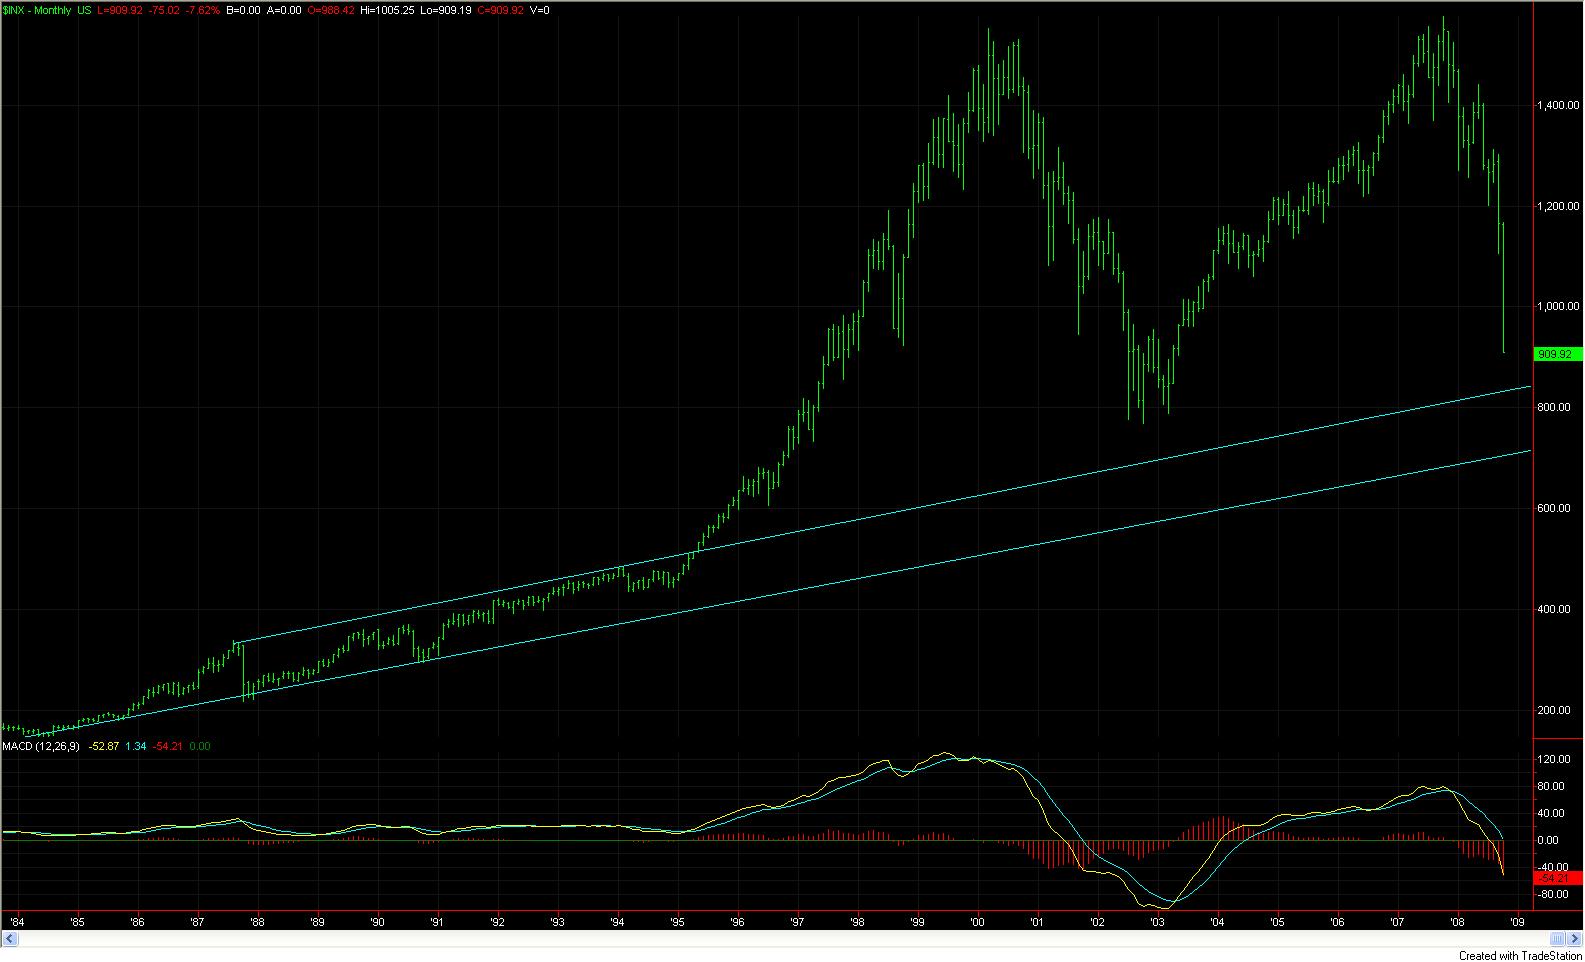
The trendlines represent an approximate 10% drift from 1982 to present - the drift channel.
Two ideas:
How likely are we to return to the drift channel (770ish SP) and fall back in line with historic drift? (Dimson, et. al.)
If 82-95 were the pre-leverage years, should we expect the market to look more like 1982-1995 when things return to 'normal', i.e., we return to a world without leverage?