Vertical Solutions Forecast
P&L’s for March and Since Inception
Quick Summary
+1.4% March
Current rate of return: +17.5% un-leveraged
Profitable 6 of last 6 months, profitable 9 of last 10 months
Drawdowns continue to be minimal
In October 2013, we developed an algorithm called Edge which has improved our results
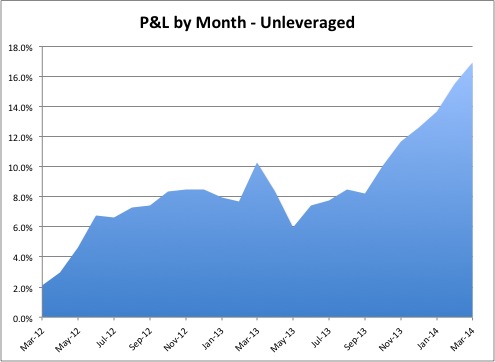
Vertical Solutions Forecast, March 2012 – March 2014, Total Return
Vertical Solutions Forecast w/ Edge, October 2013 – March 2014
| Gross | 8.7% |
| Avg/mo. | 1.5% |
| Avg/yr | 17.5% |
| % Profitable | 100% |
| Std Dev/mo | 0.4% |
| z | 8.82 |
| Sharpe | 3.6 |
Vertical Solutions Forecast, March 2012 – March 2014
| Gross | 16.9% |
| Avg/mo. | 0.7% |
| Avg/yr | 8.1% |
| % Profitable | 76% |
| Std Dev/mo | 1.2% |
| z | 2.80 |
| Sharpe | 0.6 |
Monthly Returns, March 2012 – March 2014
| Date | %/Contract |
| Mar-12 | 2.1% |
| Apr-12 | 0.9% |
| May-12 | 1.7% |
| Jun-12 | 2.1% |
| Jul-12 | -0.1% |
| Aug-12 | 0.6% |
| Sep-12 | 0.2% |
| Oct-12 | 0.9% |
| Nov-12 | 0.1% |
| Dec-12 | 0.0% |
| Jan-13 | -0.5% |
| Feb-13 | -0.3% |
| Mar-13 | 2.6% |
| Apr-13 | -1.9% |
| May-13 | -2.4% |
| Jun-13 | 1.5% |
| Jul-13 | 0.3% |
| Aug-13 | 0.7% |
| Sep-13 | -0.3% |
| Oct-13 | 1.9% |
| Nov-13 | 1.6% |
| Dec-13 | 0.9% |
| Jan-14 | 1.0% |
| Feb-14 | 1.9% |
| Mar-14 | 1.4% |
Notes:
We continue to focus on using and understanding Edge
We are working on extending the time frame of trades
Results are live trades, not a simulation
*A Sharpe Ratio on 6 months results is still a bit silly
—h
Henry Carstens
503-701-5741
carstens@verticalsolutions.com
www.verticalsolutions.com

