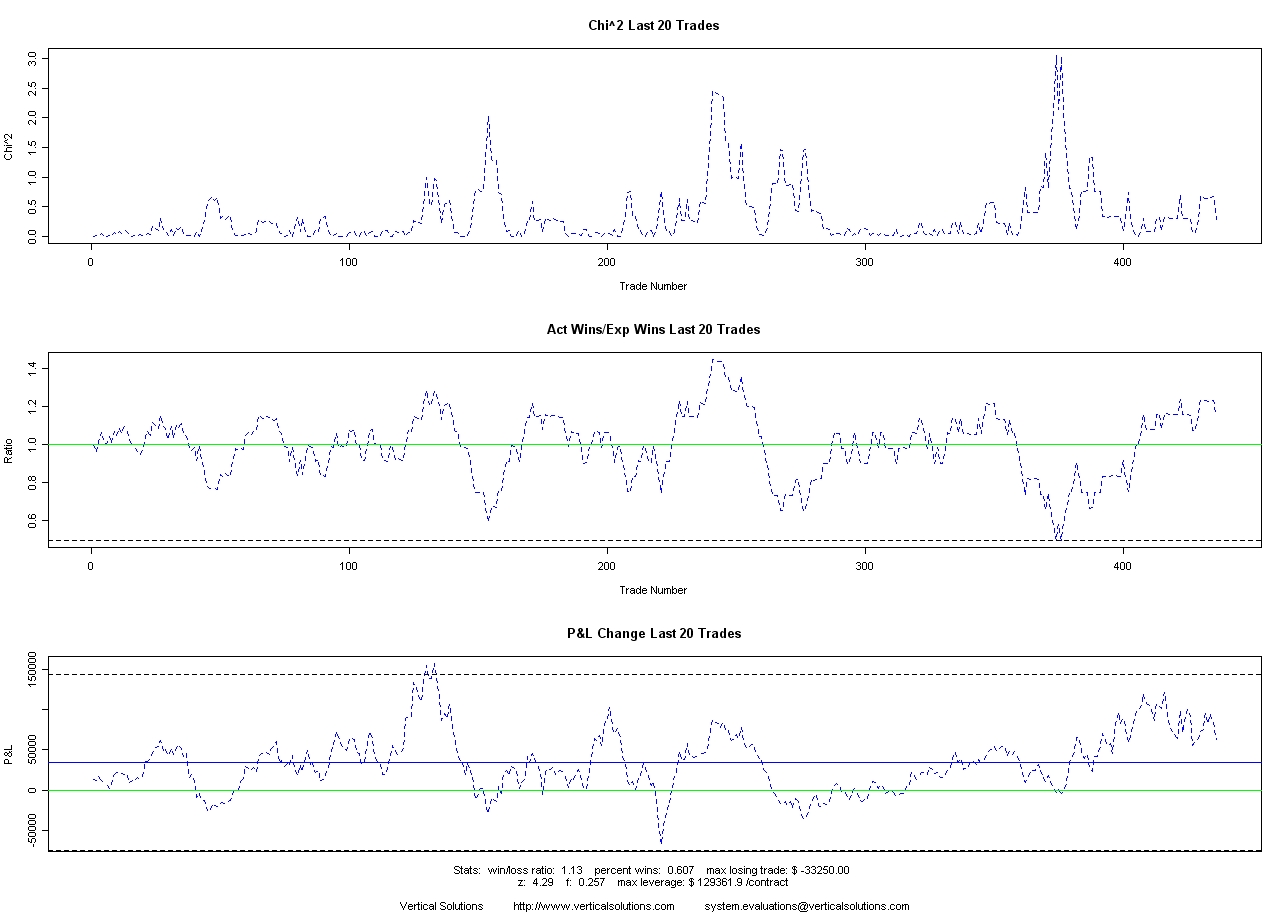
Control Charts, 8/18/05
Control Charts can be used to measure the stability and viability of a trading system. These charts measure three aspects of trading system performance:
- Chi^2 the stability of the system as a whole,
- Actual Wins vs Expected wins the stability of the system's win percentage, and
- P&L Change measures the stability of the system's profit

The Chi^2 statistic is an overall measure of the stability of the system - fewer and lower spikes are better.
The ratio of expected wins to actuals wins for the last twenty trades shows the current win/loss trend.
The rolling 20 trade P&L for the system tracks whether or not the system is making money in line with its historical performance.
Systems can be designed to turn themselves off using the above criteria. As an example, my automated systems turn themselves off if both the ratio of expected wins to actual wins and the twenty trade rolling P&L move 3 standard deviations below their average.
A failure example where both the ratio and P&L move three standard deviations from their norms in rather dramatic fashion can be found here.