Validating the Trend Day Indicator, 09/06/09
Trend Day Indicator Validation - Real Information About Future Market Movements
I'm going to use some of the concepts from Introduction to Testing Trading Ideas to validate the output from the Trend Day Indicator. This technique works with any indicator. To validate the indicator I'm going to examine the historical results as if it had been a traded as an automated trading system. Then I'm going to examine those results looking for positive expectation and statistical significance.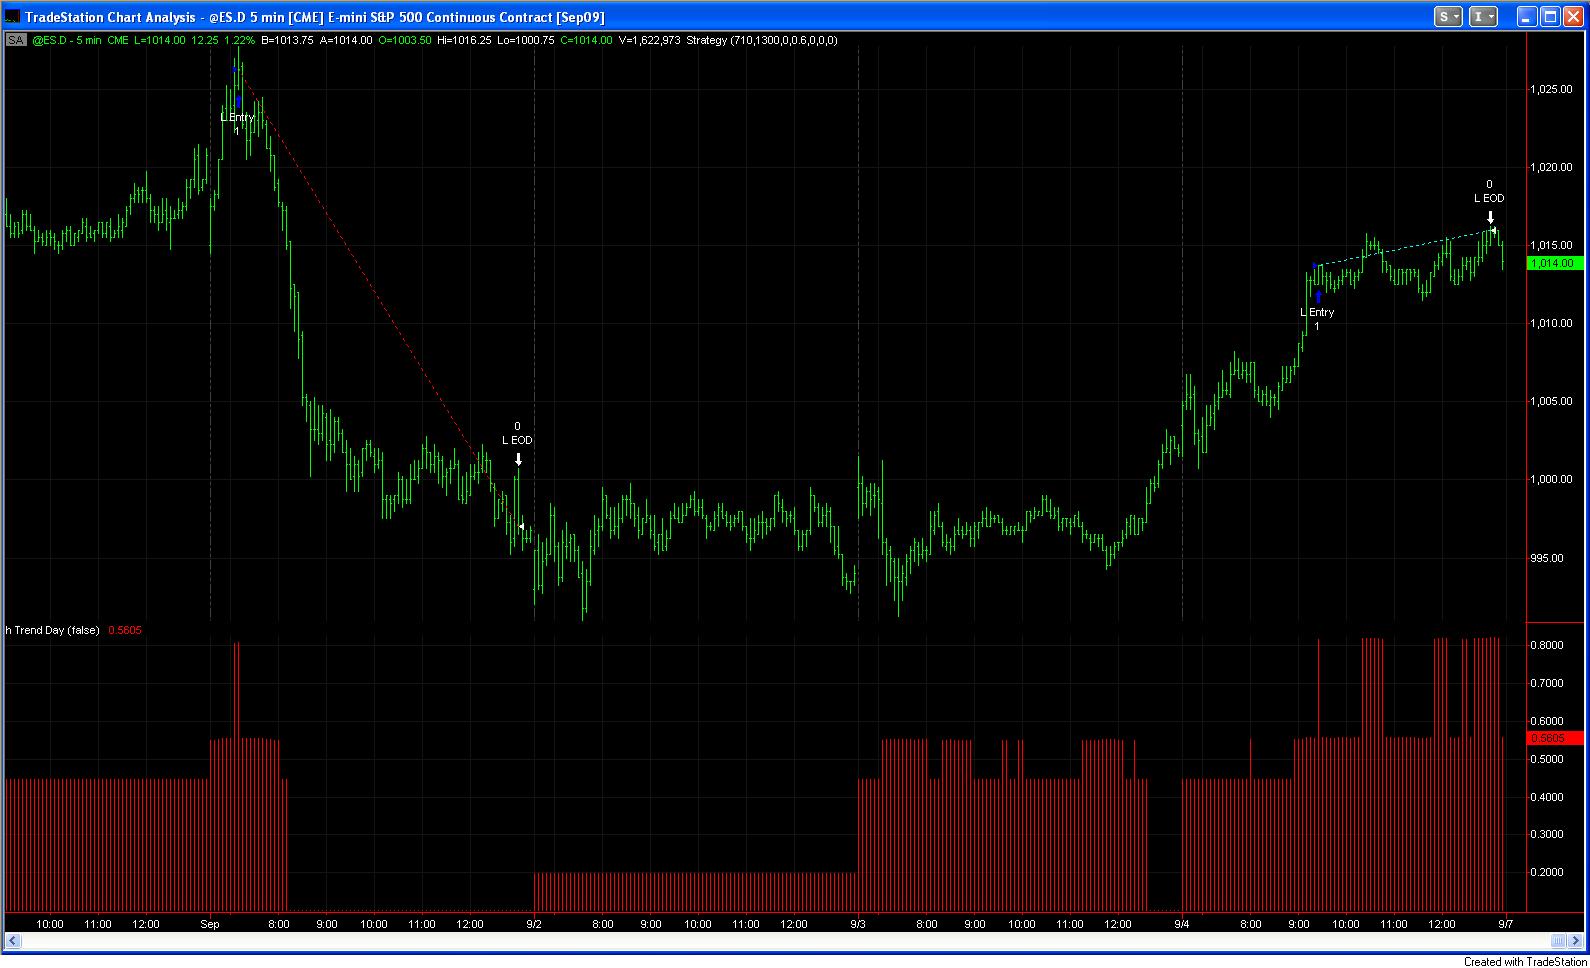
The Trend Day indicator in red.
The trading system I built buys when the indicator is over 60% and the market is up and sells when the indicator is over 60% and the market is down. Trend following with the Trend Indicator.
The system exits at the end of the day. There are no stops, slippage or commissions.
The results for the e-mini futures contract 1998-present were:
434/742, 58%, avg 1.3 pts, sd 11.4 pts, t: 3.1The t score of 3.1 means the results are significant to 3 standard deviations leaving little liklihood they occurred by chance alone. We were looking for a t score higher than 1.6.