Using Control Charts to Monitor Trading Systems
and Indicators in Uncertain Times
Control Charts for trading systems serve quantitative, qualitative and even psychological functions for comparing current and past performance. Control charts help answer the questions:
- "How are my systems and indicators performing now?", and
- "What does that performance imply about taking the next trade?", and
- "If there is a change in performance is it indicative of a change in the broader market?"
(See below for information on how we can run control charts on your systems to gain additional insight into their performance. No proprietary information required.)
How is the Red Light Green Light Indicator Performing?
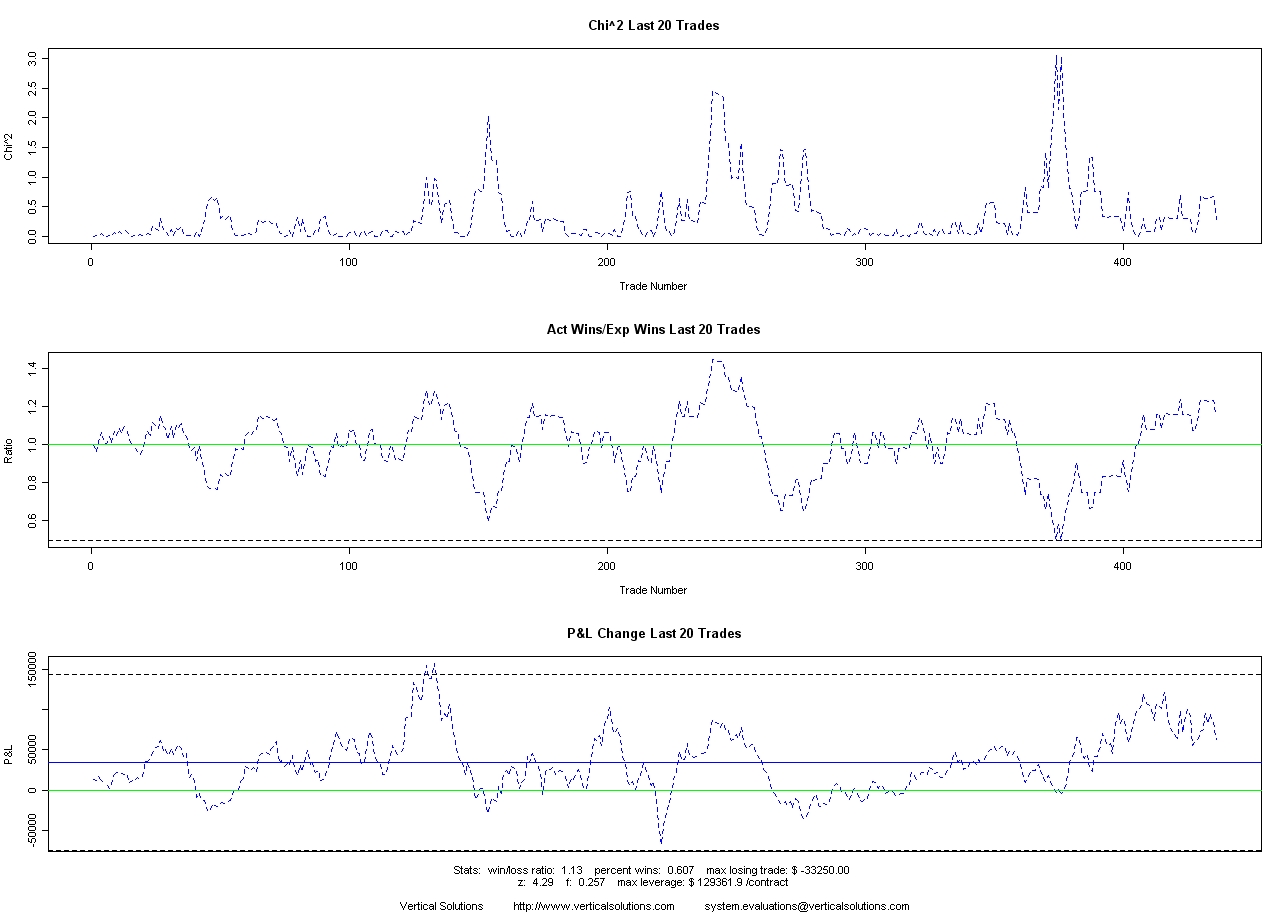
Control Charts for the Red Light Green Light Indicator (02/27/09)
The RLGL Indictor has been long (and wrong) since S&P 839, over 100 points of adverse excursion. Is the indicator still performing within its normal parameters?
The Control charts would seem to say that it is. Its P&L has been on an upswing for the last 150 trades and is quite positive. Actual vs Expected wins is similarly up and well above normal. There is a large spike in the Chi^2 chart associated with the drawdown that ended around trade 380, but that drawdown didn't have much effect on the P&L so can be dismissed for now. In general the Chi^2 peaks seem in line with past history.
For now, we'll say the Red Light Green Light Indicator is wrong but functioning well within normal parameters.
How is the S&P Strategy performing?
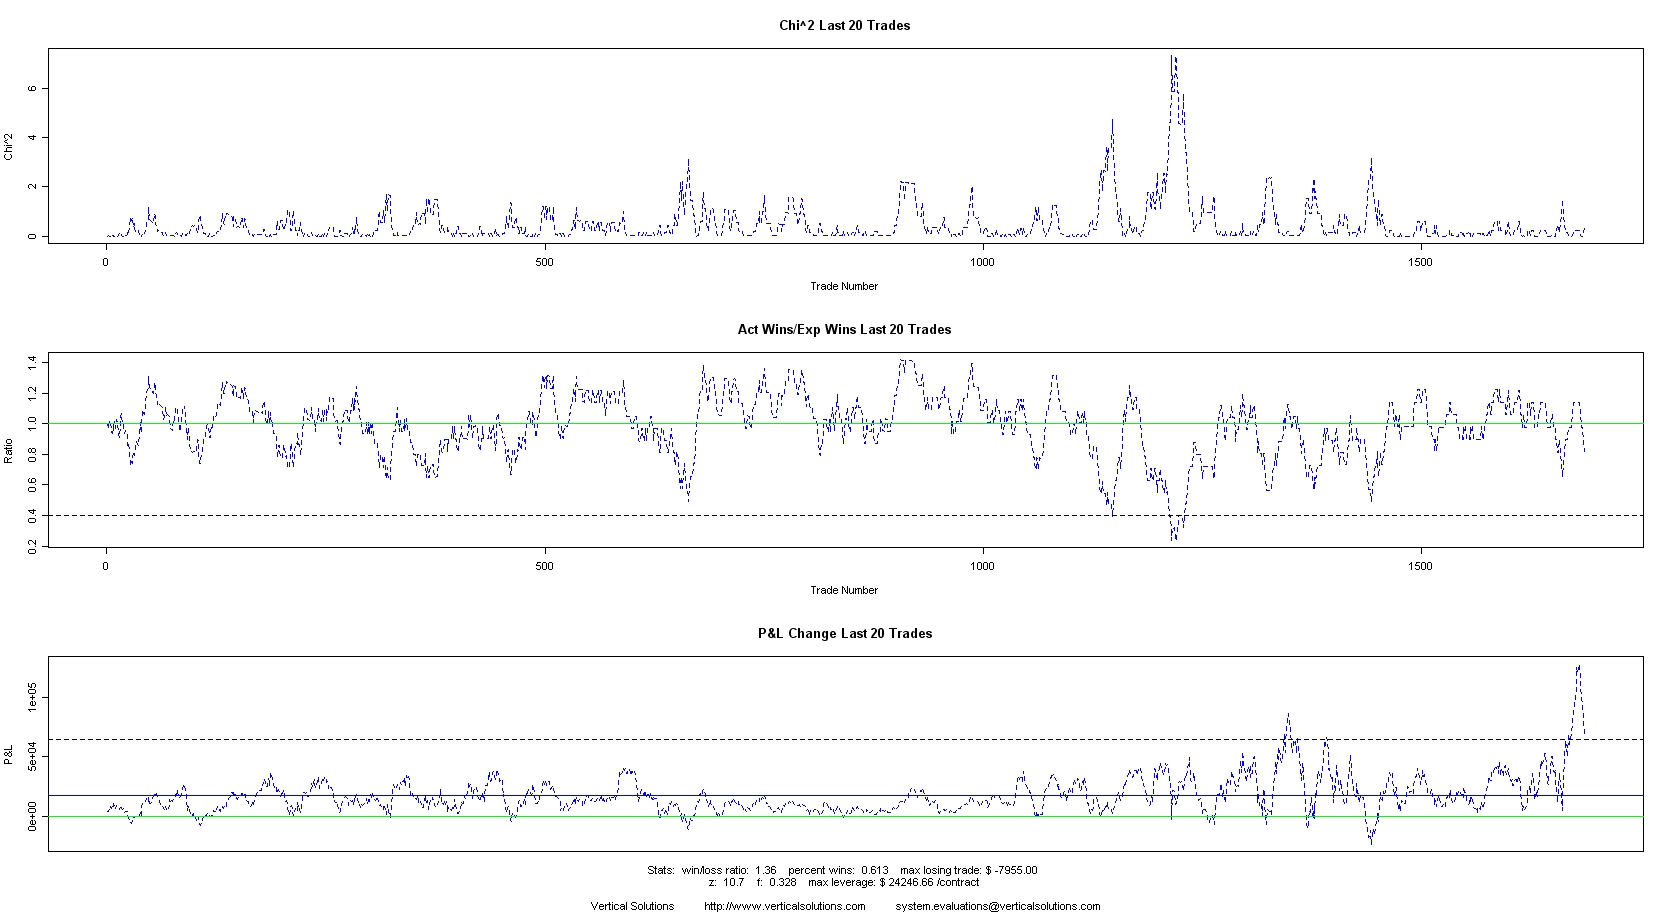
Control Charts for S&P Trading Strategy (02/27/09)
The S&P Trading Strategy had a rough February, losing most of its January gains. Is the strategy still performing within its normal parameters?
The Strategy's Control charts say that it is performing within expectations. Its P&L is coming off an upswing that saw a nice runup and remains positive. Actual vs Expected wins have been trending up over the last 1000 trades and the Chi^2 chart is trending down into expectations.
The S&P Strategy had a rough time in February but its control charts suggest it is functioning within historical parameters.
Vertical Solutions uses control charts to get a jump on learning if the market is changing out from beneath our trading systems' feet. We can also run control charts on outside systems (and discretionary traders). The process is fully automated and requires only a simple trade-by-trade P&L. No dates or othe proprietary information is required. Each evaluation report is $250 and invoiced via PayPal with the finished report. Each report includes complete instructions for interpreting the report. Satisfaction guaranteed. Send requests and questions to System Evaluation.