Fibonacci Abstractions
Market abstractions, nuances and insights look inside the data revealing an edge. But what about 'bad' abstractions - abstractions that apparently provide an insight but are built on a move away from the data instead of a look inside it?
Fibonacci numbers for example.
Here are three Fibonacci-based S&P trading systems that appear to provide an insight-
a) if month of year = 5, and if day of week = 5(Fri) then buy on the close of the day and exit on the close of the next day w/ the highest high of the last 5 daysBut do they, really?
23/28, 82%, avg $1536, sd 3899, z 2.1
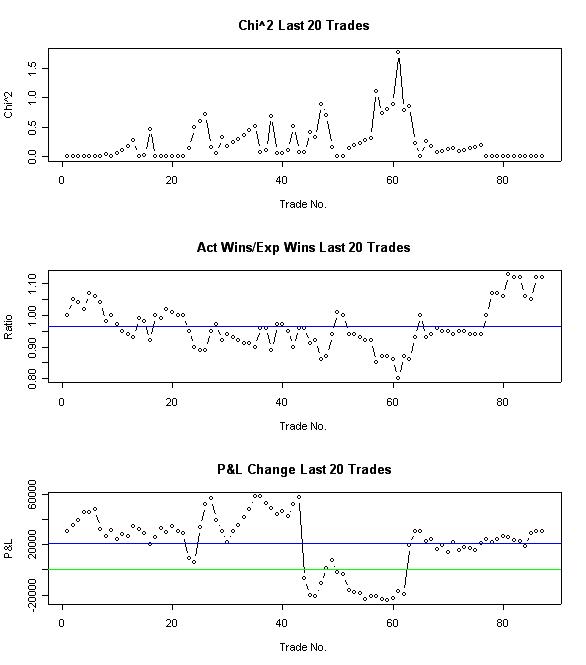
b) if day of week = 5(Fri), and if the trading day of the month is evenly divisible by 5 then buy on the close of the day and exit on the close of the next day w/ the highest high of the last 5 days
74/103, 72%, avg $1472, sd 5585, z 2.7
Control charts for b):
c) if month of year = 5, and if day of week = 5(Fri), and if the trading day of the month is evenly divisible by 5 then buy on the close of the day and exit on the close of the next day w/ the highest high of the last 5 days
10/12, 83%, avg $2120, sd 2763, z 2.7
Are day of week, month of year and trading day of month abstractions that move closer to the data or away from it? Is there enough theory behind them to provide a stable foundation for a trading system?
Are the above Fibonacci abstractions yielding chimeras in the distance or genuine insights into the data?